Visualizing Your Smart Home Health with the HA Treemap Card

As a Home Assistant environment grows, so does the effort needed for maintenance. When you have dozens of sensors, scanning a list to find a single device with a low battery or a weak signal is inefficient.
I’ve recently started using the ha-treemap-card in my maintenance dashboards. While the name suggests nesting or hierarchy, the value for me is in its ability to present many entities in a clean, color-coded, and highly readable grid.
Why This Card for Maintenance?
The primary goal here is reducing maintenance overhead. Instead of digging through sub-menus or logs, this card allows you to:
- See everything at once: It maximizes screen real estate by packing entities into a cohesive grid.
- Prioritize via color: By using state-based coloring, you can make “Problem” states (like low battery or high latency) jump out immediately.
- Filter out the noise: You can configure the card to hide “healthy” entities—for example, filtering out any battery above 30%—so you only see what needs attention.
- Clean up the UI with Regex: To keep the grid clean, you can use regex to strip redundant words from entity names, such as removing “battery level” from every tile since the context is already established.
- Keep it simple: It avoids the clutter of icons and extra text, focusing strictly on the entity name and its current state.
The card is very performant—critical when you're loading dozens of entities—and the developer has been active in fixing bugs quickly and remaining open to feature requests.
Use Cases
I’ve deployed three specific views to help keep my system reliable and stable:
1. Low Battery Tracking
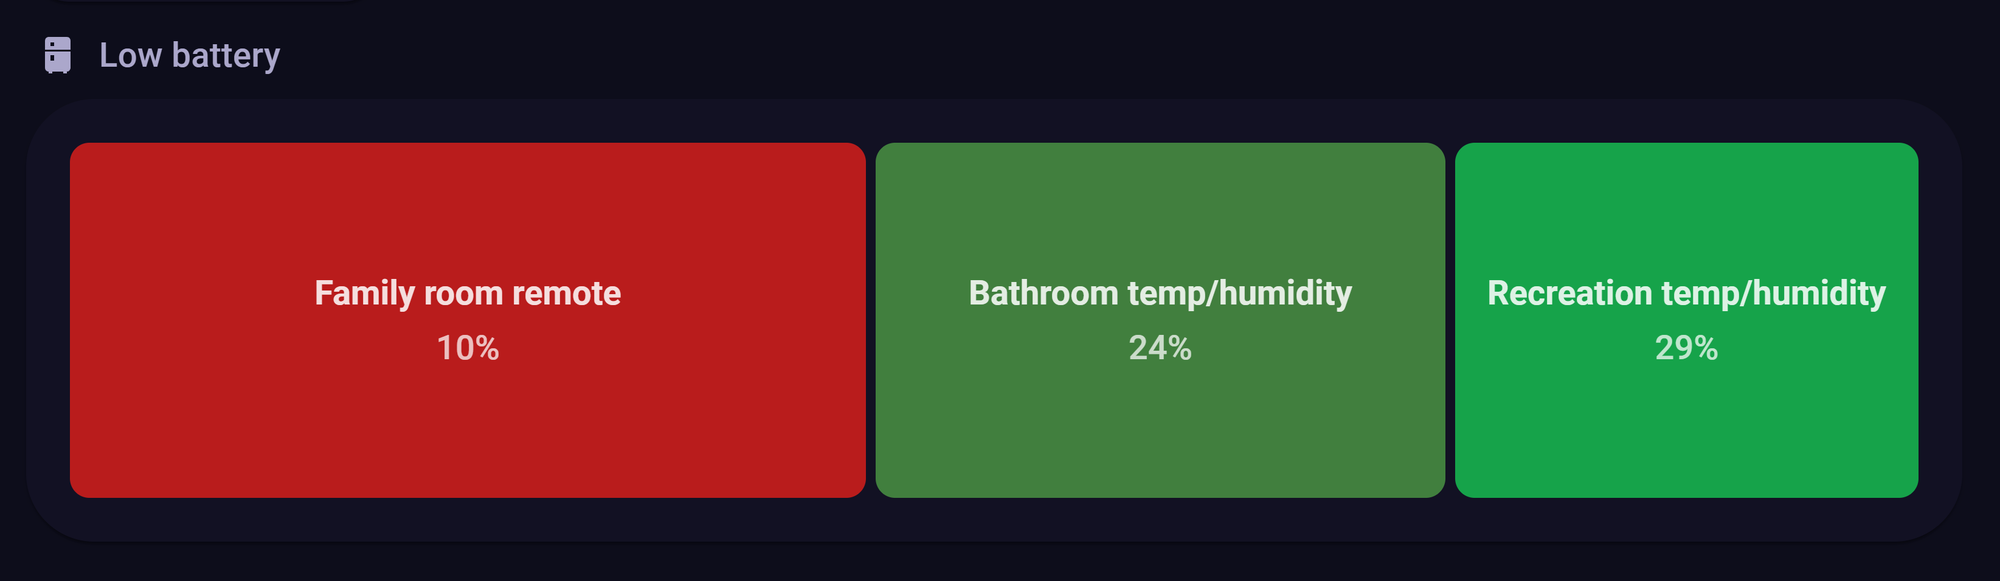
Monitoring battery levels across a whole house is a chore. In this view, I can see every battery-powered device at a glance. As seen in the screenshots, the “Family room remote switch” at 10% is highlighted in a distinct red block.
Importantly, I also include sensors that are “unavailable” or “unknown.” These often require faster remediation than a low battery, as they've already dropped off the network. This view makes them impossible to ignore and allows for “batching” maintenance rather than reacting to sensors only after they fail.
Here's a configuration that also uses auto-entities to populate the card. I also use auto-rename to do multiple renames to keep the names clean.
type: custom:auto-entities
card:
  type: custom:treemap-card
  exclude:
    - sensor.*_dial_battery
    - sensor.*_plus
  order: asc
  filter:
    below: 60
    unavailable: true
  size:
    equal: true
  value:
    suffix: "%"
    precision: 0
  sparkline:
    show: false
  color:
    target: background
filter:
  include:
    - options:
        eval_js: true
        name: >-          ${state.attributes.friendly_name.replace('H5075','temp/humidity').replace('Battery
          level','').replace('Battery','').replace(' switch','').trim() }
      domain: sensor
      attributes:
        device_class: battery
grid_options:
  columns: full
2. Identifying Connection Instability (MQTT Reconnects)
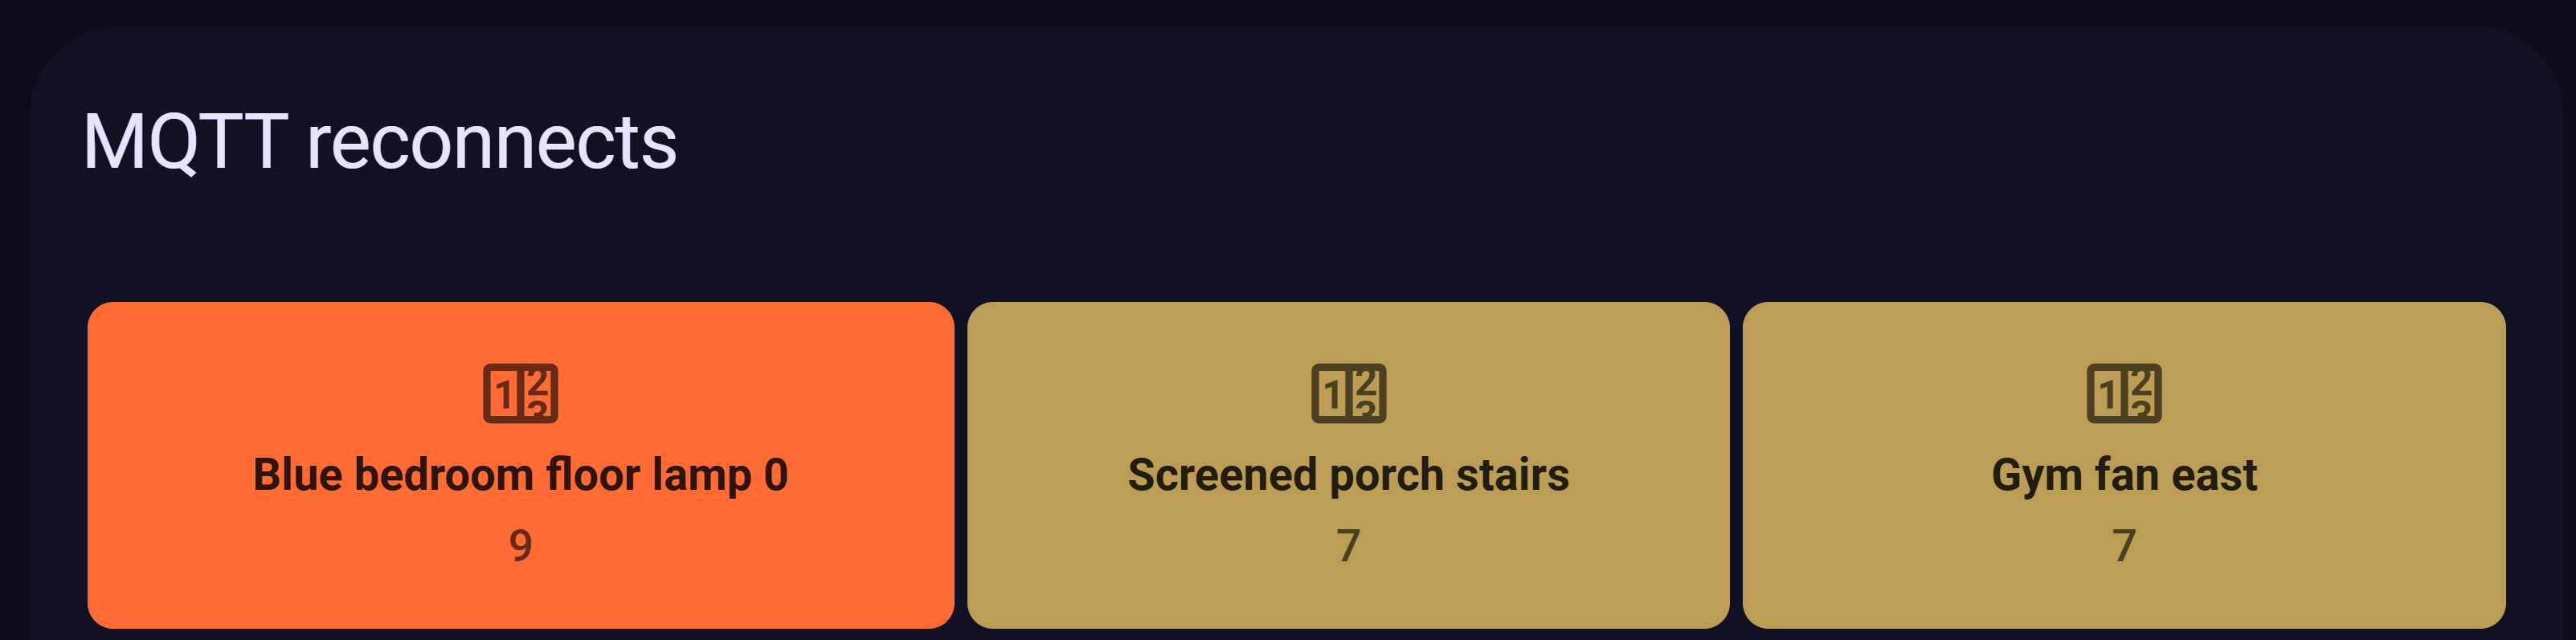
Network stability is the backbone of a reliable smart home. In a Zigbee2MQTT setup, if a device is “flapping”—dropping and reconnecting frequently—it’s usually a sign of poor signal or interference. By visualizing the reconnect count, I can quickly see that the “Bedroom ceiling” and “Recreation relay” are having issues. This visual pinpointing saves me from tailing logs to find the culprit.
A sample configuration looks like:
type: custom:treemap-card
entities:
  - sensor.*mqtt_connect_count
label:
  replace: " MQTT Connect Count?$//"
filter:
  unavailable: true
  above: 3
color:
  low: "#4dabf7"
  mid: "#69db7c"
  high: "#ff6b35"
value:
  precision: 0
size:
  equal: true
order: desc
sparkline:
  show: false
title: MQTT reconnects
grid_options:
  columns: full
3. Monitoring Wi-Fi Signal Strength
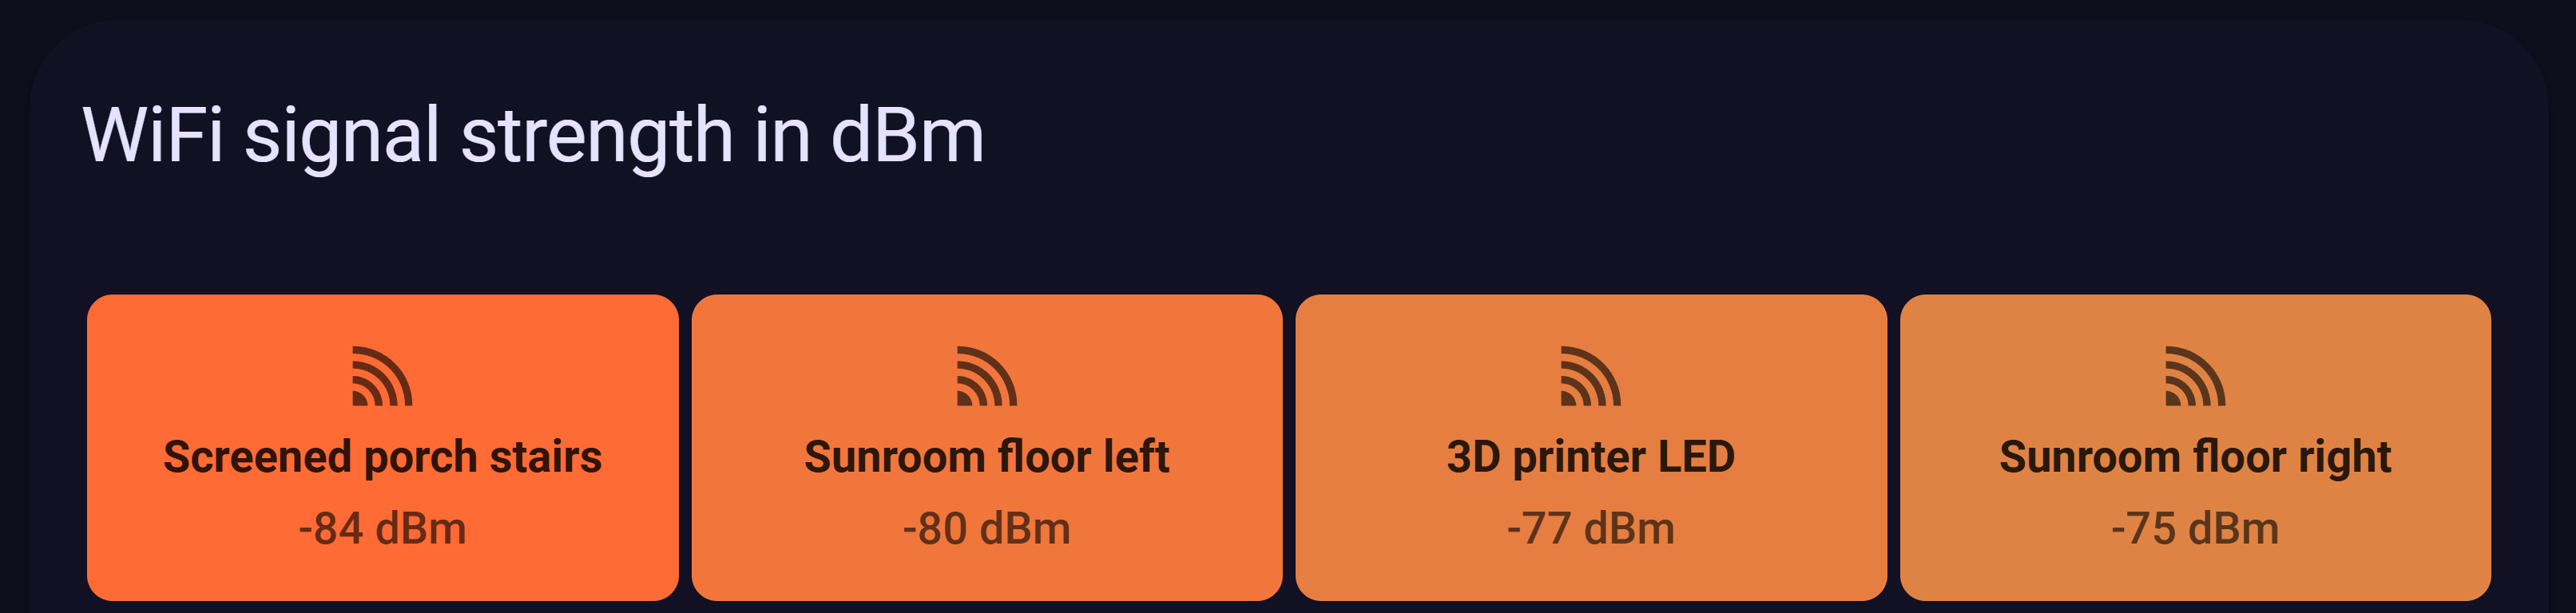
In a home with multiple access points, signal strength (dBm) is typically hidden away in attribute menus. Using this card, I’ve turned those attributes into a visual map of my Wi-Fi health. I can see that while my 3D printer is solid at -69 dBm, the “Screened porch stairs” are dipping into the -77 dBm range. Sometimes sensors do not pick an optimal access point and try to cling to a weak signal. I've been able to remediate a few of these issues by locking a sensor to an AP that definitely has a better signal.
Final Thoughts
The ha-treemap-card is a powerful tool for anyone who prioritizes system observability. It turns abstract sensor data into an actionable dashboard, helping you catch small issues before they become actual failures.
Check it out on GitHub: omachala/ha-treemap-card